Paper Review — Debug like a Human: A Large Language Model Debugger via Verifying Runtime Execution…
Debugging programs is essential yet challenging, even for advanced Large Language Models (LLMs). In their ACL 2024 paper, “Debug like a…

Paper Review — Debug like a Human: A Large Language Model Debugger via Verifying Runtime Execution Step-by-step (ACL 2024)
Debugging programs is essential yet challenging, even for advanced Large Language Models (LLMs). In their ACL 2024 paper, “Debug like a Human: A Large Language Model Debugger via Verifying Runtime Execution Step-by-step,” researchers present LDB, a framework that teaches LLMs to debug like human developers.
Background
Debugging is essential in software development, ensuring programs run correctly and efficiently. As Large Language Models (LLMs) emerge as programming aids, their ability to write code improves, but debugging remains a challenging task, particularly for runtime and logical errors. LDB addresses these challenges by building on several foundational concepts:
Execution and Verdicts
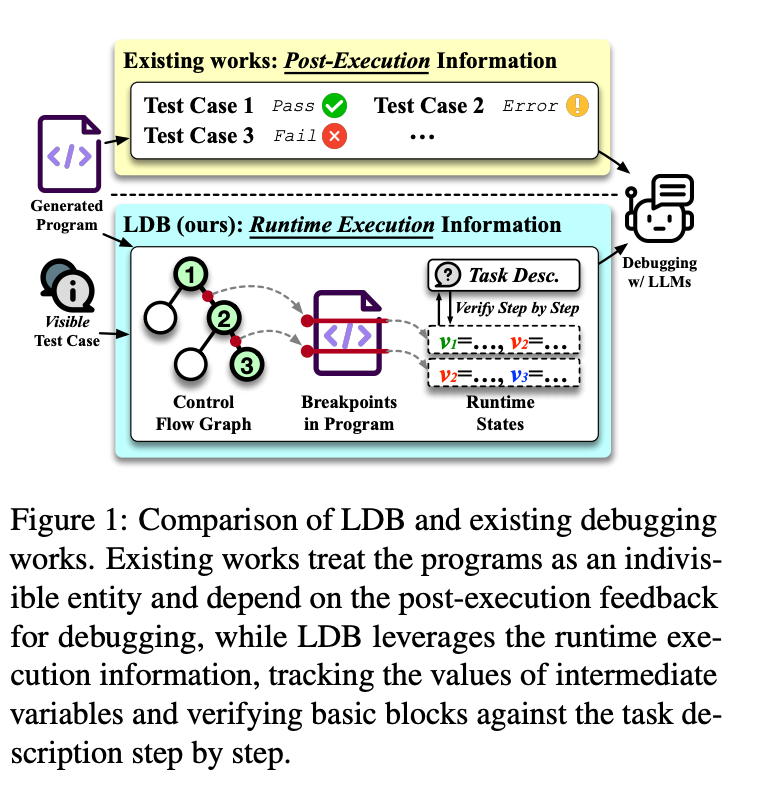
Program execution generates runtime insights, such as intermediate variable values and results, which reveal errors that static analysis might miss. Verdicts, such as whether a test case passes or fails, act as crucial feedback, guiding both developers and LLMs in identifying whether a program aligns with its intended functionality. By incorporating execution data, LDB enables LLMs to validate correctness at each step of execution, refining programs iteratively.
Control Flow and Debugging Granularity
Control Flow Graphs (CFGs) represent the logical flow of a program, with nodes as code blocks and edges as transitions. These graphs help analyze program behavior, detect loops, and trace variables. LDB leverages CFG principles by segmenting programs into basic blocks, enabling targeted debugging for individual sections. This modular approach mirrors how developers debug complex logic, focusing on isolated parts of a program before addressing the whole.
Improving Code Generation with Pass@1
Pass@1 accuracy measures the probability of an LLM generating a correct solution on its first attempt. While useful for gauging model performance, it highlights the need for robust debugging frameworks like LDB. By iteratively identifying and resolving issues, LDB improves success rates beyond the initial generation, supporting more reliable outcomes.
VLLM for Scalable Debugging
VLLM (Variable-Length Lightweight Model) provides a high-throughput, memory-efficient serving engine that ensures LDB operates at scale. It enables responsive real-time debugging by processing inputs efficiently, allowing LDB to deliver iterative improvements without significant delays.
Key Features of LDB
LDB focuses on making debugging for LLM-generated code more efficient and precise by combining runtime execution insights and step-by-step validation.
Here’s how LDB tackles the debugging process:
1. Breaking Code into Basic Blocks
LDB segments a program into basic blocks, smaller chunks of code that represent individual steps in the logic. This modular approach mirrors how developers debug complex logic, focusing on one part at a time before addressing the entire program. By validating each block iteratively, LDB ensures that errors are identified and resolved at their root.
2. Tracking Intermediate States
LDB captures runtime execution data, such as variable values and execution paths, after each block. These intermediate states provide insights that static analysis often misses, such as identifying edge cases or misaligned logic. By analyzing these states, LDB enables precise localization of bugs.
3. Human-Inspired Debugging Granularity
Using Control Flow Graphs (CFGs), LDB visualizes the logical flow of a program. Nodes represent basic blocks, and edges show transitions. This allows LDB to focus debugging efforts on isolated segments while maintaining a broader understanding of the program’s structure — similar to how developers debug step-by-step.
4. Iterative Refinement
LDB adopts an iterative approach:
- Profile the program by executing it and capturing failures.
- Debug the program using intermediate states and test case results.
- Regenerate code to fix errors and repeat the process until the program passes all tests.
This ensures a systematic refinement process, improving accuracy with each iteration.
5. Scalability with VLLM
To handle the computational demands of debugging, LDB integrates with VLLM, a lightweight, memory-efficient serving engine. This ensures real-time debugging, allowing the framework to operate seamlessly on large datasets.
Experiments
LDB has been evaluated on several benchmarks, including HumanEval, MBPP (Mostly Basic Programming Problems), and TransCoder.

Here’s what makes LDB stand out:
1. Problem Formulation
Each task involves generating and refining code based on a problem description, visible test cases (to guide debugging), and hidden test cases (for final evaluation). LDB focuses on using runtime execution feedback to identify and resolve errors effectively.
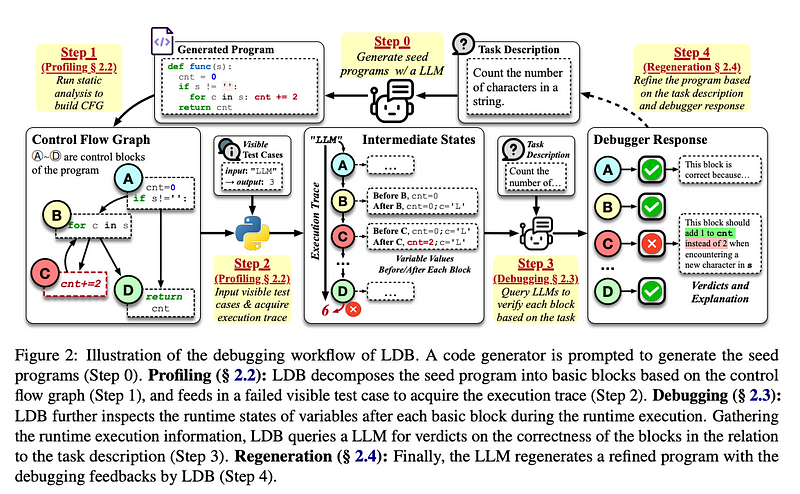
2. Debugging Workflow
- Profiling: Collect runtime data, segment execution into blocks, and inspect intermediate variable states.
- Debugging Verdicts: The LLM evaluates whether each block aligns with the intended functionality, flags buggy blocks, and provides explanations for errors.
- Regeneration: Using the debugging feedback, LDB refines the program iteratively until it passes all visible tests or reaches the iteration limit.
3. Experimental Results
LDB has demonstrated significant improvements in debugging performance, achieving state-of-the-art accuracy on HumanEval, MBPP, and TransCoder benchmarks. For example:
- LDB outperformed existing methods by up to 9.8%, showcasing its ability to address complex bugs.
- Even when applied to advanced models like GPT-4, LDB enhanced code quality by leveraging runtime execution insights.
Code Explanation
The original code for the LLMDebugger project is available on GitHub.
1. Tokenizer Initialization
The tokenizer is initialized to count tokens processed during debugging. This helps in monitoring efficiency and API usage costs.
from transformers import GPT2Tokenizer
tokenizer = GPT2Tokenizer.from_pretrained("gpt2")
2. Main Debugging Function
This function performs the step-by-step debugging process for a single programming task.
Function: debug()
This function performs the step-by-step debugging process for a single programming task.
2.1 Initialization
The components necessary for debugging are initialized:
PyExecutor: Executes Python code and returns results.PyGenerator: Handles LLM-based code generation and improvements.model_factory: Creates the specified LLM interface.
exe = PyExecutor()
gen = PyGenerator()
model = model_factory(model_name, port)
2.2 Initial Implementation
The function generates the initial implementation of the code based on the dataset’s seed and prompt.
cur_func_impl = prepare_function_from_seed(
    dataset_type, item["prompt"], item["seed"], item["entry_point"]
)
implementations.append(cur_func_impl)
2.3 Execution and Feedback
The generated implementation is executed using the executor, and the failed test cases are logged as feedback.
is_passing, failed_tests, _ = exe.execute(cur_func_impl, tests_i)
test_feedback.append(failed_tests)
If the implementation passes all tests, the function exits early.
if is_passing:
    is_solved = exe.evaluate(item["entry_point"], cur_func_impl, item["test"], timeout=10)
    break
2.4 Debugging Iterations
If the initial attempt fails, the function enters an iterative debugging loop.
while cur_iter < max_iters:
    # Select a random failed test for debugging
    selected_test = failed_tests[random.randint(0, len(failed_tests) - 1)] if failed_tests else None
# Use LDB to generate an improved implementation
messages = gen.ldb_debug(
item["prompt"],
debug_cur_func_impl,
selected_test,
item["entry_point"],
model,
messages,
dataset_type,
level,
)cur_func_impl, cur_messages = gen.ldb_generate(
func_sig=item["prompt"],
model=model,
prev_func_impl=cur_func_impl,
messages=messages,
failed_tests=selected_test,
dataset_type=dataset_type,
)2.5 Refining Code
The debug process refines code using test feedback. This involves:
- Adding comments to clarify the function’s purpose.
- Adjusting logic based on failed test cases.
if dataset_type in ["HumanEval", "MBPP"]:
    # Add comments based on the prompt
    if not find_comment(cur_func_impl, item["entry_point"]):
        debug_cur_func_impl = insert_comment(
            cur_func_impl, extrace_comment(item["prompt"]), item["entry_point"]
        )
2.6 Evaluation and Exit
After each iteration, the refined implementation is tested. If all internal tests pass, the implementation is evaluated against the real test cases.
is_passing, failed_tests, _ = exe.execute(cur_func_impl, tests_i)
if is_passing:
    is_solved = exe.evaluate(item["entry_point"], cur_func_impl, item["test"], timeout=10)
    if is_solved:
        item["solution"] = cur_func_impl
    break
2.7 Logging Results
The function logs debugging results, including:
- Whether the task was solved.
- Intermediate implementations and feedback.
- Token usage during debugging.
item["is_passing"] = is_passing
    item["is_solved"] = is_solved
    item["implementations"] = implementations
    item["test_feedback"] = test_feedback
    item["solution"] = cur_func_impl
    item["generated_test"] = tests_i
    item["debug_iter"] = cur_iter
    item["token_nums"] = token_nums

    with FileLock(log_path + ".lock"):
        write_jsonl(log_path, [item], append=True)
    print(f'completed {i+1}/{num_items}')
3. Parallel Debugging
Function: run_ldb()
This function orchestrates debugging across multiple tasks in the dataset.
3.1 Preparing Arguments
The dataset is processed, and arguments are prepared for debugging.
args = iter(
    [
        (i, item, log_path, model_name, num_items, pass_at_k, max_iters, port, level)
        for i, item in enumerate_resume(dataset, log_path, seedfile, testfile)
    ]
)
3.2 Running in Parallel
The debugging tasks are executed sequentially or in parallel, depending on the n_proc value.
if n_proc == 1:
    for item in args:
        debug(*item)
else:
    with Pool(n_proc) as pool:
        pool.starmap(debug, args)
3.3 Calculating Accuracy
After all tasks are processed, the function calculates accuracy as the percentage of solved tasks.
print("Accuracy:", count_solved(log_path))Example Flow of Debugging
Input:
- A dataset with tasks, including a
prompt,seed, and test cases.
Execution:
- Initial implementation generated.
Debugging iterates until:
- Tests pass.
- Maximum iterations are reached.
Output:
Logs containing:
- Final solution.
- Intermediate feedback.
- Debugging statistics (e.g., tokens used, iterations).