Hyperparameter Tuning
Understanding Hyperparameter Optimization with Numpy

Understanding Hyperparameter Optimization with Numpy
Hyperparameter tuning finds the best hyperparameter values for the model by searching over a set of values that is specified for each of the hyperparameters.
Outline of this post:
- Parameter and Hyperparameter
- Validation data
- Search Methods
- Scale
- Hyperparemeter Optimization with Code
Parameter and Hyperparameter
- Parameter is a configuration variable(e.g., weight, bias) that is internal to the model and whose value can be estimated from data.
- Hyperparameter is a configuration (e.g., learning rate, weight decay) that is external to the model and whose value cannot be estimated from data.
Validation data
An optimization procedure is used to discover a set of hyperparameters that perform well or best on the dataset. There are three types of data;
- Train data: train parameters
- Validation data : validate hyperparameters
- Test data: test a model for general use
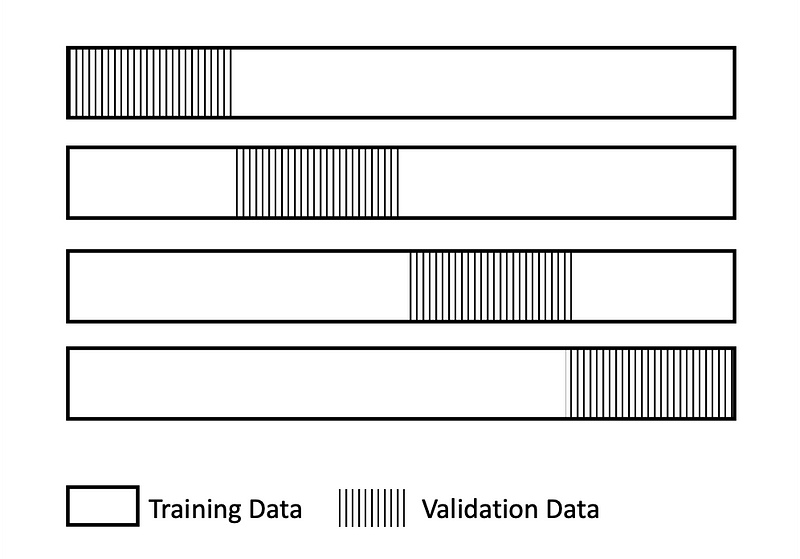
Cross-validation is a technique to evaluate predictive models by dividing the original sample into a training set to train the model, and a test set to evaluate it. The k-fold cross-validation procedure is an effective approach for estimating the performance of a model.
Scale
Linear scale
Hyperparameter tuning searches the values in the hyperparameter range by using a linear scale. Typically, this is useful when the range of all values from the lowest to the highest is relatively small (within one order of magnitude). This is because uniformly searching values from the range will give you a reasonable exploration of the entire range.
Logarithmic scale (log scale)
Hyperparameter tuning searches the values in the hyperparameter range by using a logarithmic scale. Logarithmic scaling works only for ranges that have only values greater than 0. Logarithmic scaling is useful when searching a range that spans several orders of magnitude.
For example, suppose range is from -4 to 0. You can pick a number x at a regular probability and apply 10^x.
Hyperparameter Search Methods
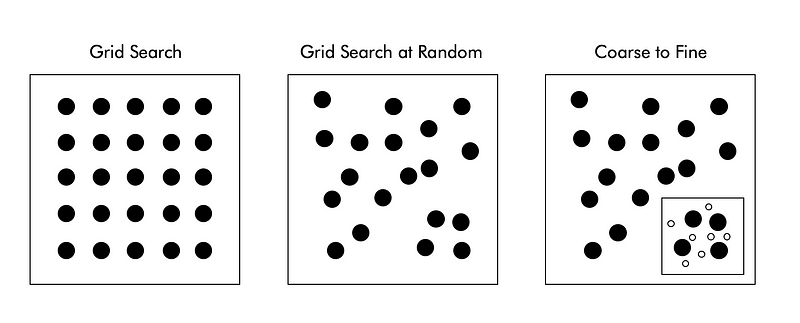
Grid search
Define a search space as a grid of hyperparameter values and evaluate every position in the grid. This method is suited best when you already know the suitable hyperparameter space for your case.
Grid search at random
Define a search space as a bounded domain of hyperparameter values and randomly sample points in that domain. Random search is great for discovery and getting hyperparameter combinations that you would not have guessed intuitively.
Coarse to fine
This method is sampling with Grid Search coarsely the hyperparameter space at first, and concentrate samples where validation score is higher.
Hyperparemeter Optimization with Code
Import
You can find modules from this github
# coding: utf-8
import sys, os
sys.path.append(os.pardir)
import numpy as np
import matplotlib.pyplot as plt
from dataset.mnist import load_mnist
from common.multi_layer_net import MultiLayerNet
from common.util import shuffle_dataset
from common.trainer import Trainer
Data Preparation
(x_train, t_train), (x_test, t_test) = load_mnist(normalize=True)# Downsize training data
x_train = x_train[:500]
t_train = t_train[:500]# Split 20% of data for validation
validation_rate = 0.20
validation_num = int(x_train.shape[0] * validation_rate)
x_train, t_train = shuffle_dataset(x_train, t_train)x_val = x_train[:validation_num]
t_val = t_train[:validation_num]
x_train = x_train[validation_num:]
t_train = t_train[validation_num:]Trainer
def __train(lr, weight_decay, epocs=50):
    network = MultiLayerNet(input_size=784, hidden_size_list=[100, 100, 100, 100, 100, 100],
                            output_size=10, weight_decay_lambda=weight_decay)
    trainer = Trainer(network, x_train, t_train, x_val, t_val,
                      epochs=epocs, mini_batch_size=100,
                      optimizer='sgd', optimizer_param={'lr': lr}, verbose=False)
    trainer.train()
return trainer.test_acc_list, trainer.train_acc_listHyperparamter Search and Training
np.random.uniform returns a value uniformly distributed between low and high. We will search 2 types of hyperparamter.
Weight decay
Weight decay is one form of regularization and it plays an important role in training so its value needs to be set properly.
Weight decay is defined as multiplying each weight in the gradient descent at each epoch by a factor λ [0<λ<1].
Learning rate (lr)
Learning rate is a tuning parameter in an optimization algorithm that determines the step size at each iteration while moving toward a minimum of a loss function.
# Grid search at random ======================================
optimization_trial = 100
results_val = {}
results_train = {}
for _ in range(optimization_trial):
# Set the range of Hyperparamter Search ===============
weight_decay = 10 ** np.random.uniform(-8, -4)
lr = 10 ** np.random.uniform(-6, -2)
# ================================================val_acc_list, train_acc_list = __train(lr, weight_decay)
print("val acc:" + str(val_acc_list[-1]) + " | lr:" + str(lr) + ", weight decay:" + str(weight_decay))
key = "lr:" + str(lr) + ", weight decay:" + str(weight_decay)
results_val[key] = val_acc_list
results_train[key] = train_acc_list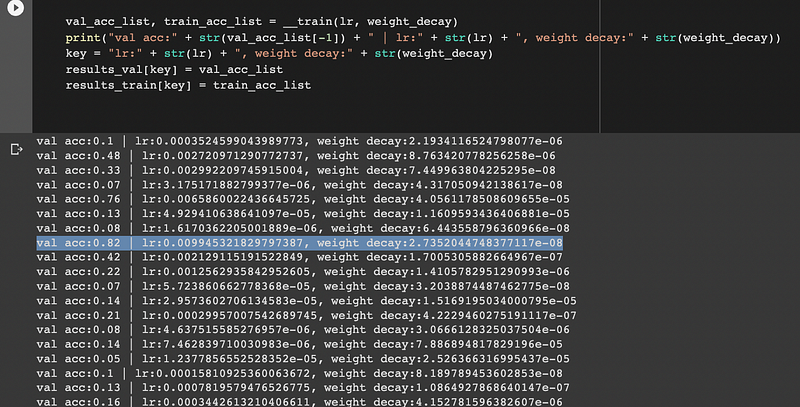
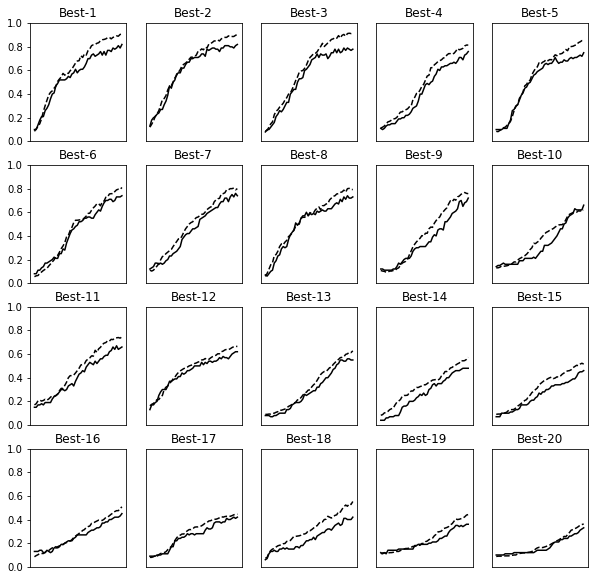
The best val acc is 0.82 with 0.0099 of lr and 2.7352e-08 of weight decay.
Graph
This is for drawing graphs of the best 20 results.
print("=========== Hyper-Parameter Optimization Result ===========")
graph_draw_num = 20
col_num = 5
row_num = int(np.ceil(graph_draw_num / col_num))
i = 0plt.figure(figsize=(10,10))for key, val_acc_list in sorted(results_val.items(), key=lambda x:x[1][-1], reverse=True):
print("Best-" + str(i+1) + "(val acc:" + str(val_acc_list[-1]) + ") | " + key)plt.subplot(row_num, col_num, i+1)
plt.title("Best-" + str(i+1))
plt.ylim(0.0, 1.0)
if i % 5: plt.yticks([])
plt.xticks([])
x = np.arange(len(val_acc_list))
plt.plot(x, val_acc_list)
plt.plot(x, results_train[key], "--")
i += 1if i >= graph_draw_num:
breakplt.show()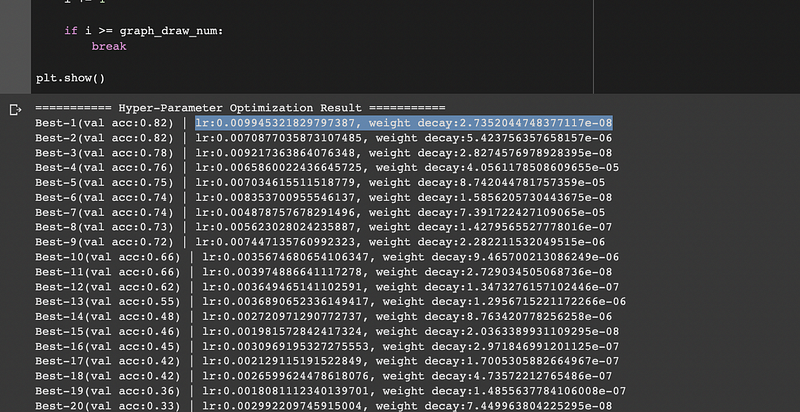
Thank you for reading.